Last week I showed you some results obtained with an Artificial Neural Network (ANN). The ANN classified the crystal compounds into perovskite or non-perovskite. The input data (features) fed to the ANN contained information about atomic radii, electronegativities, electronegativity differences and quotients of the atomic radii. All the features were constructed considering the number of different sites, which are the Wyckoff sites of a crystal compound.
The features constructed in this manner are strongly related to the composition (formula) of the material. Consider the perovskite compound CaSnO3. In the Crystallography Open Database there are two CIF numbers for the same compound. There is one with the number 1541644, which adopts the ideal perovskite structure, with the space group Pm-3m. The other one with the number 9014466 adopts the trigonal space group R-3c. Both perovskite structures are described with three Wyckoff sites. Due to the methodology described in the last post, we do not expect that the features corresponding to the CaSnO3 either trigonal or cubic are different. Then, the Artificial Neural Network does not distinguish between both perovskite structures for the compound CaSnO3. Similar cases, where there are two perovskite space groups, are found for other compounds in the Crystallography Open Database, such as CaZrO3 (with the CIFs 1532747 and 1542029), CsAuCl3 (1010072 and 1510091), CsPbBr3 (1530681 and 153062), or La2MnCoO6 (1532786 and 1532794), for instance.
What comes next it is to construct features that take into account those differences arising from different space groups. In fact, this is basically to consider the spatial arrangements of the atoms. In this manner, the features would not only describe a material in terms of its composition, but also in its structure (spatial arrangement).
In a first instance, I considered the density of the material, ρ, to model the spatial arrangement. The density of a material is computed as follows:

where Z is the unit-formulas within the unit-cell; µ corresponds to the molar mass of the material; V is the volume of the unit-cell; and NA is the Avogadro number. The volume of the unit-cell takes into account the changes in the space group for a material with the same crystal structure. The phase transitions of a perovskite compound come with changes in the size of the unit cell; i.e. the volume. Additionally, the phase transitions also change the number of unit-formulas of the material.
The formula of the material density also allows to model solid solutions, as well as compounds which have vacancies. In this manner, one can incorporate a feature to the input data which makes the difference for a compound with two different space groups.
Another approach to incorporate features describing the spatial arrangement is with local functions. I will describe them in the next post, since I consider that the topic deserves complete attention apart. Nevertheless, if you want to give a glance on those local functions, I recommend you to dive into J. Solid State Chemistry 285, 121253 (2020). The local functions used to show the results here are similar to those published in the mentioned Journal, except for a cosine factor.
In summary, the features to use for a collection of compounds characterized with four sites are:
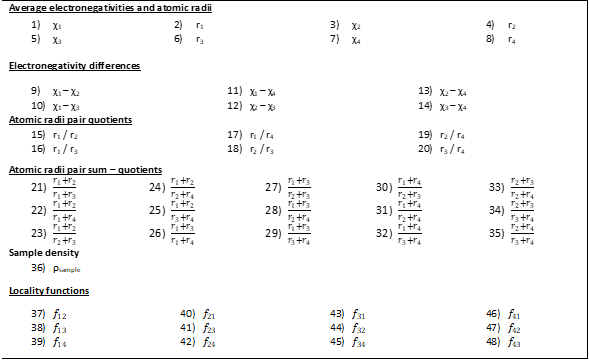
The subindices refer to a given site. The notation fij refer to the local functions. The subindex i refers to a site considered as the central atom, and the one with j refers to the neighbors located in a different site j. Remember that the sites are related to the Wyckoff sites (last post).
Then, there are 48 features to use in the training of Artificial Neural Networks. However, I will show you the results obtained with three different ANNs:
- Several ANNs where trained without using local functions; i.e, there were 36 features.
- Several ANNs where trained without using the electronegativity differences. Thus, there were 42 features.
- Several ANNs where trained without using the average atomic radii and electronegativities, as well as the electronegativity differences. Therefore, 34 features were used to trained the ANNs.
I will only show you the result with the best ANN of each type. In all ANNs, the same compounds collection was used: there were 2006 compounds in the training set, 428 in the cross-validation set, and the same last number in the test set. The trainings were done in a machine with 16 GB RAM 1066 MHz, with a processor Intel® CoreTM i7 CPU @ 2.80 GHz. The OS was Ubuntu 16.04, with the Python library Keras, using Theano as backend. Each training (validation) lasted around 3 minutes for each ANN. The testing lasted less than a second.
Table 1, Table 2, Table 3 shows the metrics of precision, recall and F1-score for the best ANN of the type A, B, and C. Remember that the samples labelled as True were the perovskite compounds, whereas those labelled as False were the non-perovskite compounds. You may notice that the metrics scored above 90 % in all cases, even with samples never used to optimize the ANN (test set). However, the scores absolutely improved with the ANN of type C: no average atomic radii or electronegativities, no electronegativity differences. In addition, the difference in the scores between the samples of the training and cross-validation sets with the ones of the test set decreased with the ANN of type C. This difference is related to overfitting, a problem related to the capabilities of an ANN (and any machine learning tool) to generalize.
| Cost Function | Precision (%) | Recall (%) | F1 – score (%) | Description |
| 0.2064 (Training) 0.1987 (CV) | After training/CV: 95.12 (False) 94.61 (True) 94.865 (Mean) In test set: 91.74 (False) 93.33 (True) 92.535 (Mean) | After training/CV: 94.58 (False) 95.15 (True) 94.865 (Mean) In test set: 93.46 (False) 91.59 (True) 92.525 (Mean) | After training/CV: 94.85 (False) 94.88 (True) 94.865 (Mean) In test set: 92.59 (False) 92.45 (True) 92.52 (Mean) | Two hidden layers with 108 and 36 nodes. Dropout fraction of 0.40 |
| Cost Function | Precision (%) | Recall (%) | F1 – score (%) | Description |
| 0.1028 (Training) 0.1160 (CV) | After training/CV 98.36 (False) 98.28 (True) 98.32 (Mean) In test set: 93.58 (False) 95.24 (True) 94.41 (Mean) | After training/CV: 98.27 (False) 98.36 (True) 98.315 (Mean) In test set: 95.33 (False) 93.46 (True) 94.395 (Mean) | After training/CV: 98.31 (False) 98.32 (True) 98.315 (Mean) In test set: 94.44 (False) 94.34 (True) 94.39 (Mean) | Two hidden layers ordered with 84 and 126 nodes. Dropout fraction equals 0.50 |
I have to mention that the used compounds collection contained only compounds with originally three or four Wyckoff sites, either perovskite or non-perovskite type. With this in mind, I also show you the results with another test. This second test used all the remaining non-perovskite compounds of the database. The remaining compounds had up to four Wyckoff sites. Remember that the number of constructed features depend on the compound characterization in terms of sites. Therefore, the trained ANNs were capable to manage compounds with up to four Wyckoff sites. The results in the second test are in Table 4. Although the ANNs were not trained with non-perovskite compounds originally with one or two Wyckoff sites, the ANNs correctly classified those compounds as non-perovskite type. In fact, with the ANN of type C, all compounds originally with one Wyckoff site (presumably elements) are labelled as non-perovskite. Similarly, the ANN – C almost classifies all compounds with two Wyckoff sites as non-perovskite. This is important since these metrics are related to the quality of the used features. Besides, a chemist has the intuition to not consider the compounds with less than three Wyckoff sites to be a perovskite. I may suggest that the trained ANNs developed this intuition in a certain way.
| Best ANN of each type | Samples with 1 occupied site (1189) | Samples with 2 occupied sites (4307) | Samples with 3 occupied sites (5443) | Samples with 4 occupied sites (3401) |
| ANN – A | 98.22 % | 97.96 % | 95.71 % | 98.40 % |
| ANN – B | 98.91 % | 92.50 % | 94.67 % | 96.77 % |
| ANN – C | 100.00 % | 98.12 % | 95.57 % | 95.03 % |
You could use the trained ANNs to assess the probability to adopt the perovskite structure of a proposed compound as follows:
- You propose a composition (formula) of the material.
- You propose the perovskite space group.
- You propose the lattice parameter for your proposed perovskite compound.
- You propose how the atoms occupy the Wyckoff sites of the perovskite compound.
- You compute the input data based on your proposed compound.
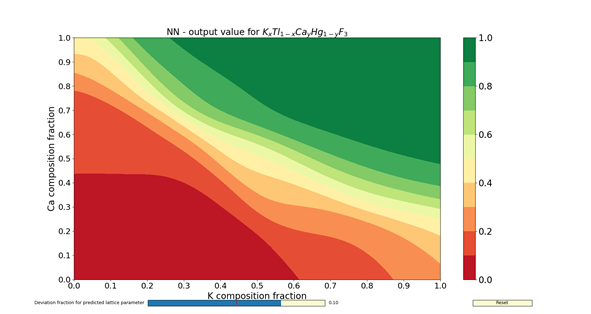
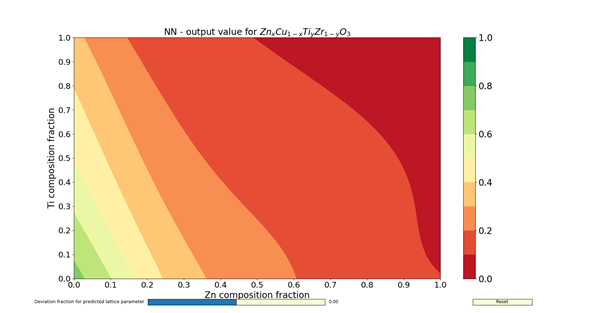
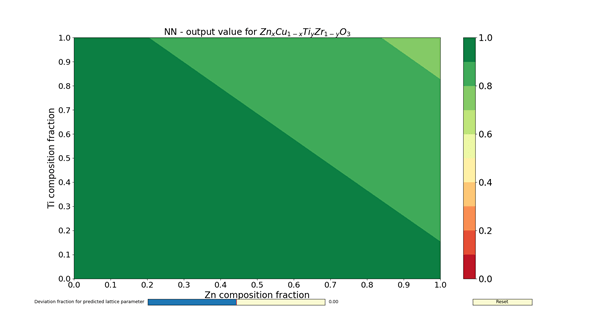
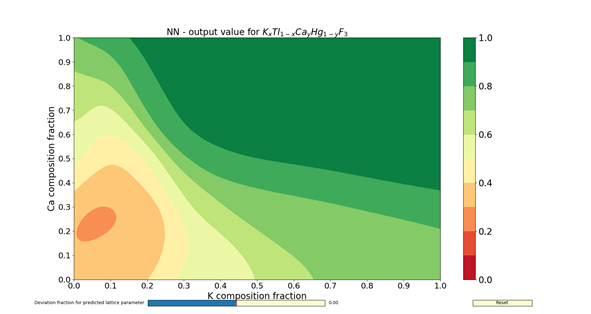
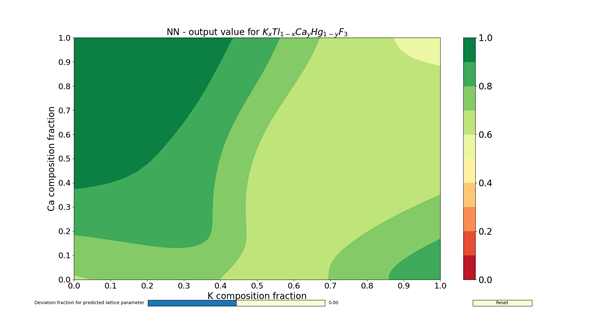
The figures 1 – 4 show the colormaps of the simulated compounds ZnxCu1-xTiyZr1-yO3 and KxTl1-xCayHg1-yO3. These compounds were simulated assuming the ideal perovskite structure (cubic symmetry). The elements in the formula with an x in the subindex shared the same site. The same can be said for those having the subindex y. In fact, the elements with the subindex x shared the cubeoctahedral site, whereas those with y shared the octahedral site. The colormaps of the figures 1 and 3 were computed with the ANN of type A. Similarly, the colormaps of the figures 2 and 4 were computed with the ANN of type C. All colormaps were computed using a step size of Δx = Δy = 0.01. Then, there are 10,201 different compositions in each colormap. The greener the composition, the larger the probability to adopt the perovskite structure. The lattice parameter was calculated as the sum of the atomic radii of the octahedral atom with the atom in vertex (oxygen). The used atomic radii were those reported by Rahm, Ashcroft and Hoffmann in 2016.
In summary, the capabilities of different ANNs and its potential use to search new perovskite compounds were shown. These ANNs contained not only information about the chemical composition, but also the spatial arrangement. The results I have shown here were filed for almost two years, and correspond to a time before the publication of my article in Journal of Solid State Chemistry. The answer for the question about which ANN to use (either A- or C-type) is left to the reader. Despite of this, the assessments done by the ANNs are faster than any chemical calculations.
